 TurningTrade
What a footprint chart shows
A footprint splits each bar by price. At each price it prints what traded during the bar, split in two: contracts sold at market, which hit the bid, and contracts bought at market, which lift the offer. That’s the bid × ask view. Vendors don’t all call it the same thing: Numbers Bars at Sierra Chart, “also known as” Footprint1, Volumetric Bars at NinjaTrader2, Cluster chart at Quantower3.
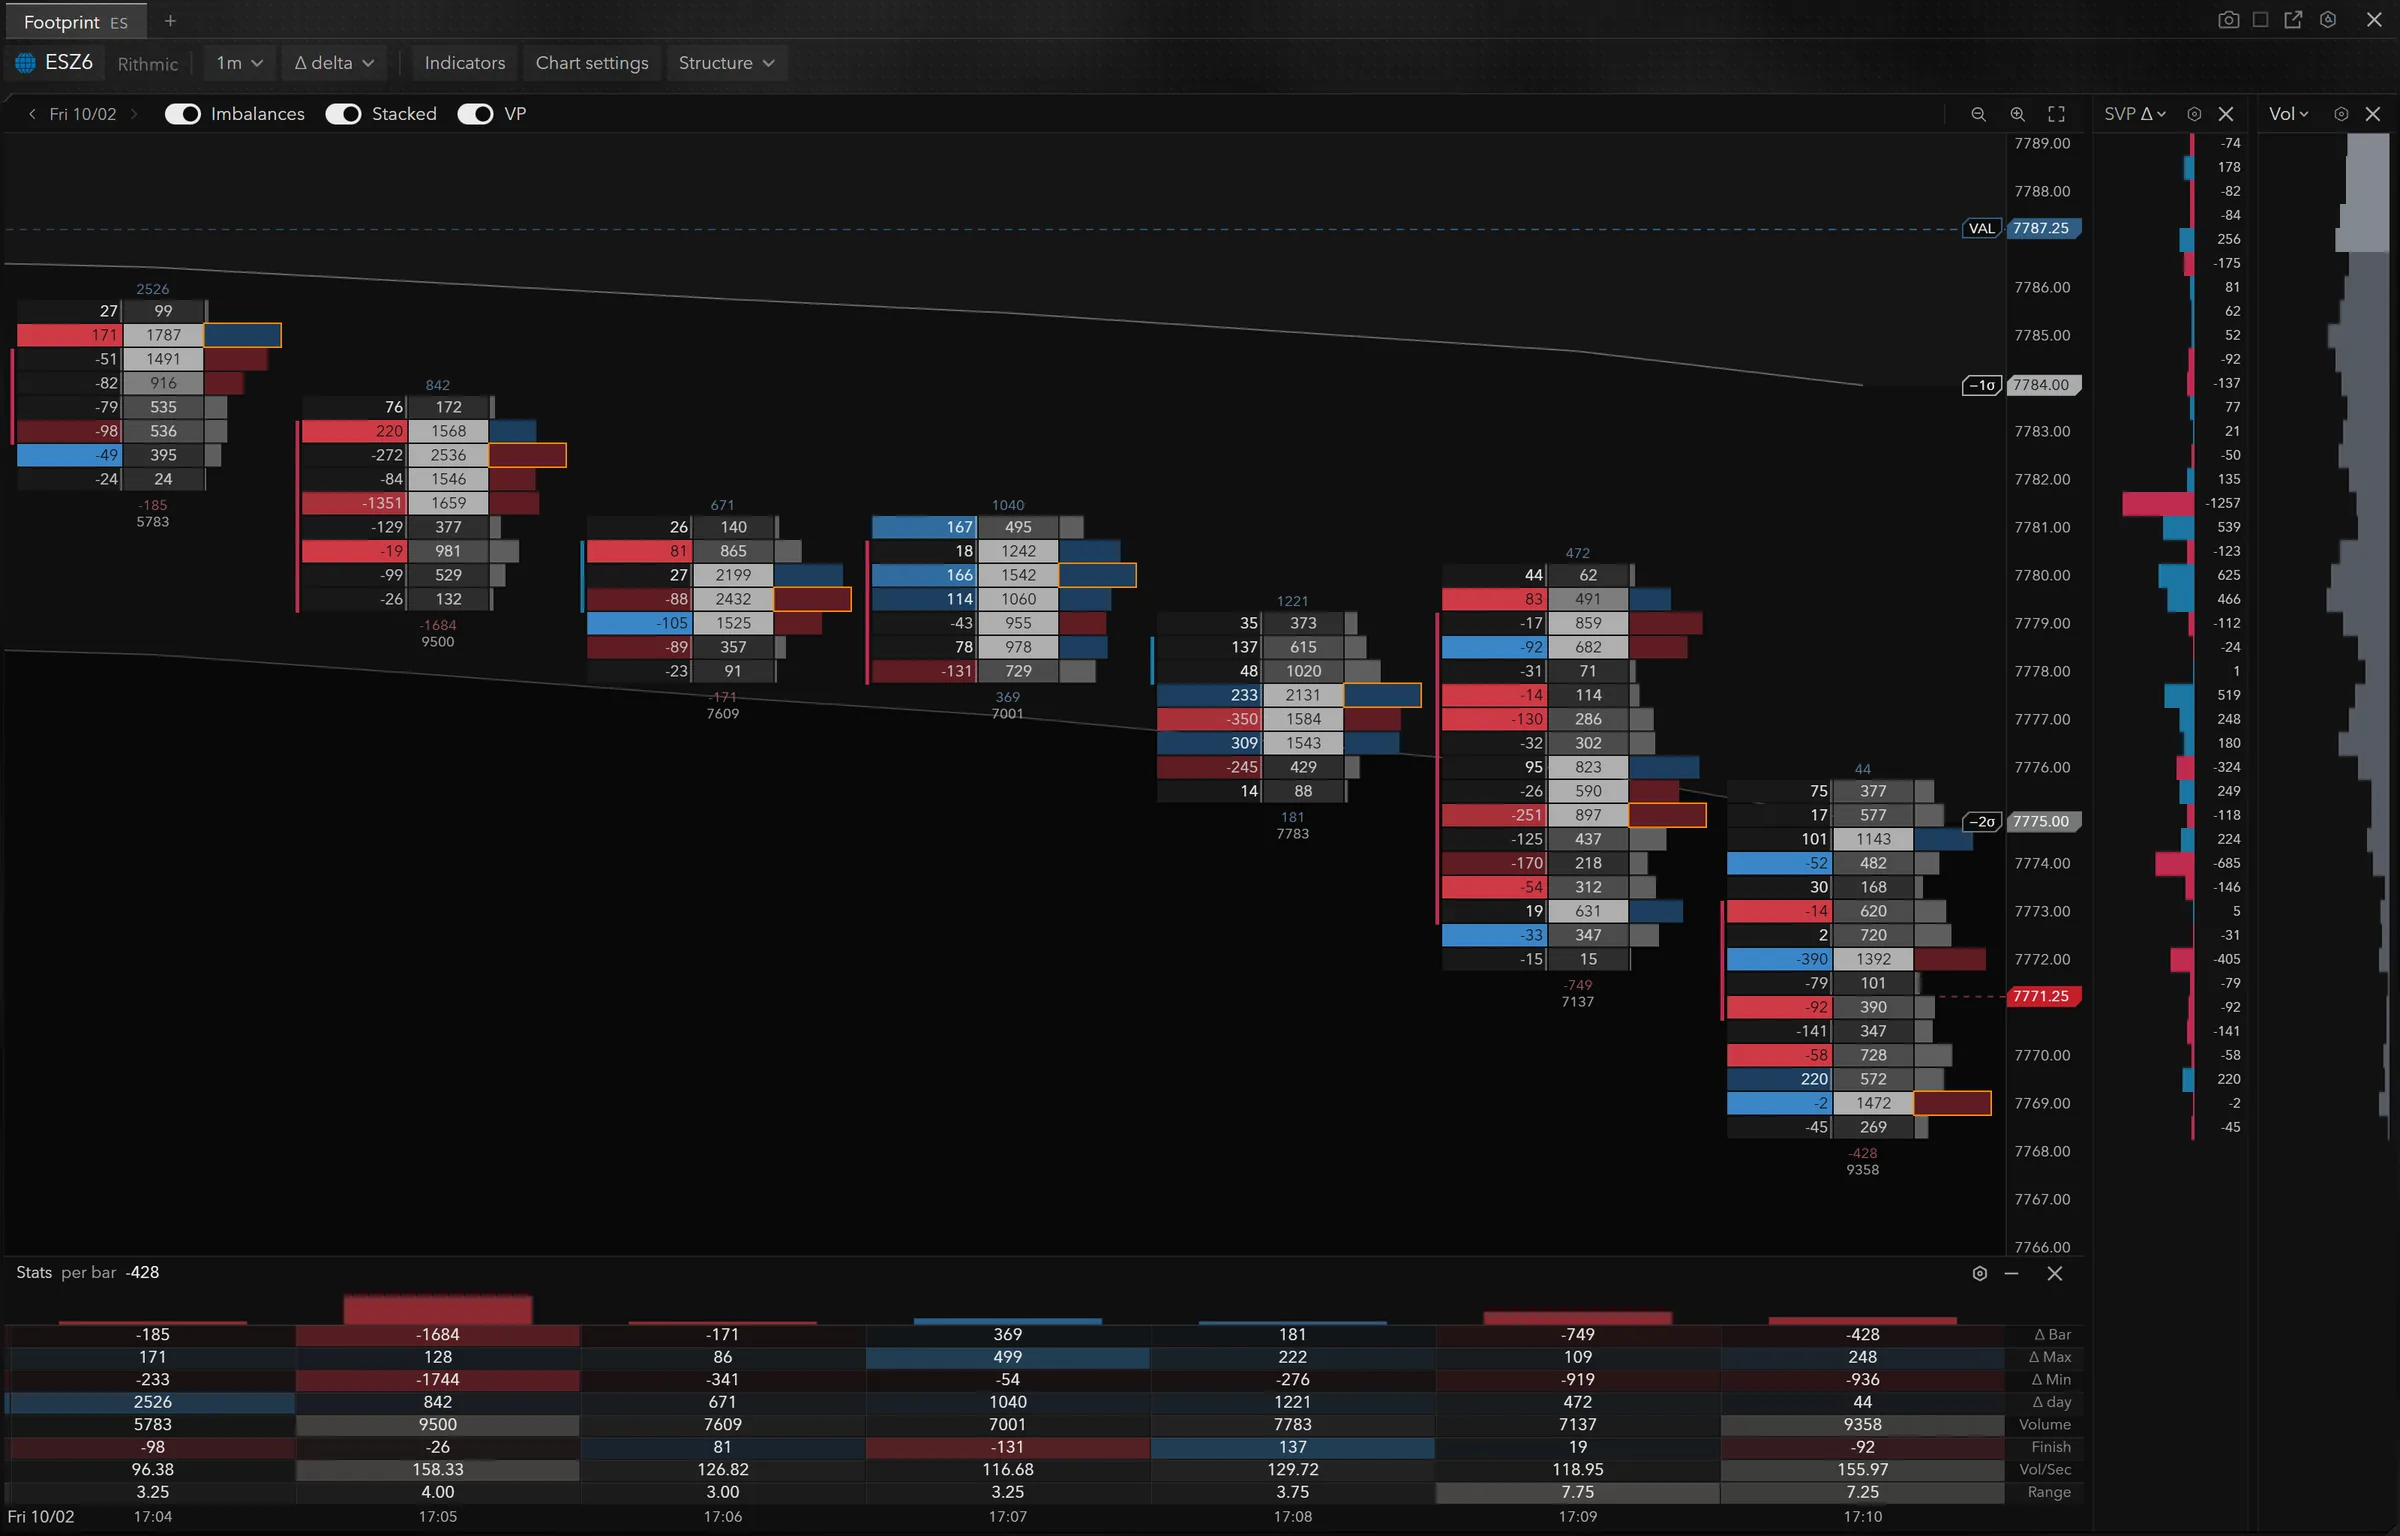
The same footprint can be drawn another way. In delta mode, each price shows the delta (bought at market minus sold at market) and the total volume. The screenshot below uses that mode: delta on the left of each cell, volume on the right.
Reading a cell: bid × ask and delta per price
Take the 17:05 bar in the screenshot below, the heaviest on screen: −1,684 delta on 9,500 contracts. At 7,781.50 the cell shows −1,351 on the left and 1,659 on the right: 1,659 contracts traded at that price, 1,351 more sold than bought. In bid × ask, the same cell reads 1,505 × 154: 1,505 sold at market, 154 bought.
One cell on its own says little. What matters is where it sits: at the top of a rising bar, at the low of a wick, near the bar’s most traded price. Here the heavy selling lands two rows below the orange frame, which marks the bar’s most traded price: 7,782.50, 2,536 contracts.
Under the bar: delta, Δ max, Δ min
The bar’s delta sums up the fight at the close. Δ max and Δ min tell you how it got there: the highest and lowest delta reached during the bar. Two bars at +100 delta don’t tell the same story if one of them went to −200 first.
On the same screenshot, the 17:05 bar closes at −1,684, with a Δ max of 128 and a Δ min of −1,744: it closes almost on its worst delta, sellers pressed to the end. The 17:09 bar closes at −749 with a Δ min of −919, the 17:10 bar at −428 with a Δ min of −936: both went through worse during the bar than the close shows.
By contrast, the 17:07 bar closes at +369 with a Δ max of 499 and a Δ min of −54: buyers led almost all the way. And the 17:10 bar has a 7.25-point range, with a Δ max of 248, a Δ min of −936 and a close at −428: its delta went through both signs inside the same bar, which the close alone hides.
Large trades
A footprint adds things up. One 150-lot order and 150 one-lot orders make the same cell. Large trades pull that information back out of the sum: the module circles them, with their size. That marker is off in the screenshot above, so the cell numbers stay readable.
TurningTrade’s footprint shows bid × ask, large trades, and Δ max / Δ min under the bar. Settings are covered in the Help Center.
Footprint imbalance is read on the diagonal
An imbalance flags a price where one side overwhelmed the other. You don’t compare the two numbers of the same cell: a market buyer lifts the offer, which sits one tick above the bid. So Sierra Chart compares the bid volume at one price with the ask volume at the next price up1. NinjaTrader makes the same diagonal comparison, with a ratio of 1.5 and a minimum delta of 10 by default2. Quantower has a dedicated cluster type, “Imbalance”, with bid sells on the left and ask buys on the right3.
Several imbalances stacked on consecutive prices, on the same side, mark a zone where aggression was repeated. Traders often use them as a reference when price comes back: the zone holds, or it gives way.
Absorption: heavy selling, no drop
Absorption is when one side hits hard and price doesn’t follow. Sellers send hundreds of contracts at market over two or three prices, and price doesn’t move one more tick. Someone on the other side took it all with limit orders.
In the screenshot, the 17:05 bar is the counter-example: −1,684 delta on 9,500 contracts, a Δ min of −1,744, and the next bar goes lower (7,778.00 against 7,779.50). Sellers finished the bar in control and nothing absorbed. That’s a reading, not a signal. For absorption, look for the opposite: heavy selling at market and a low that doesn’t move.
In TurningTrade, absorption is read by eye on the footprint. The heatmap’s Absorption and Exhaustion detectors are announced, not shipped; only Stop-run and Sweep are, off by default. The order-level book, which tells a level that got eaten from a level that got pulled, is covered in our MBO data guide.
Asking for a zone reading
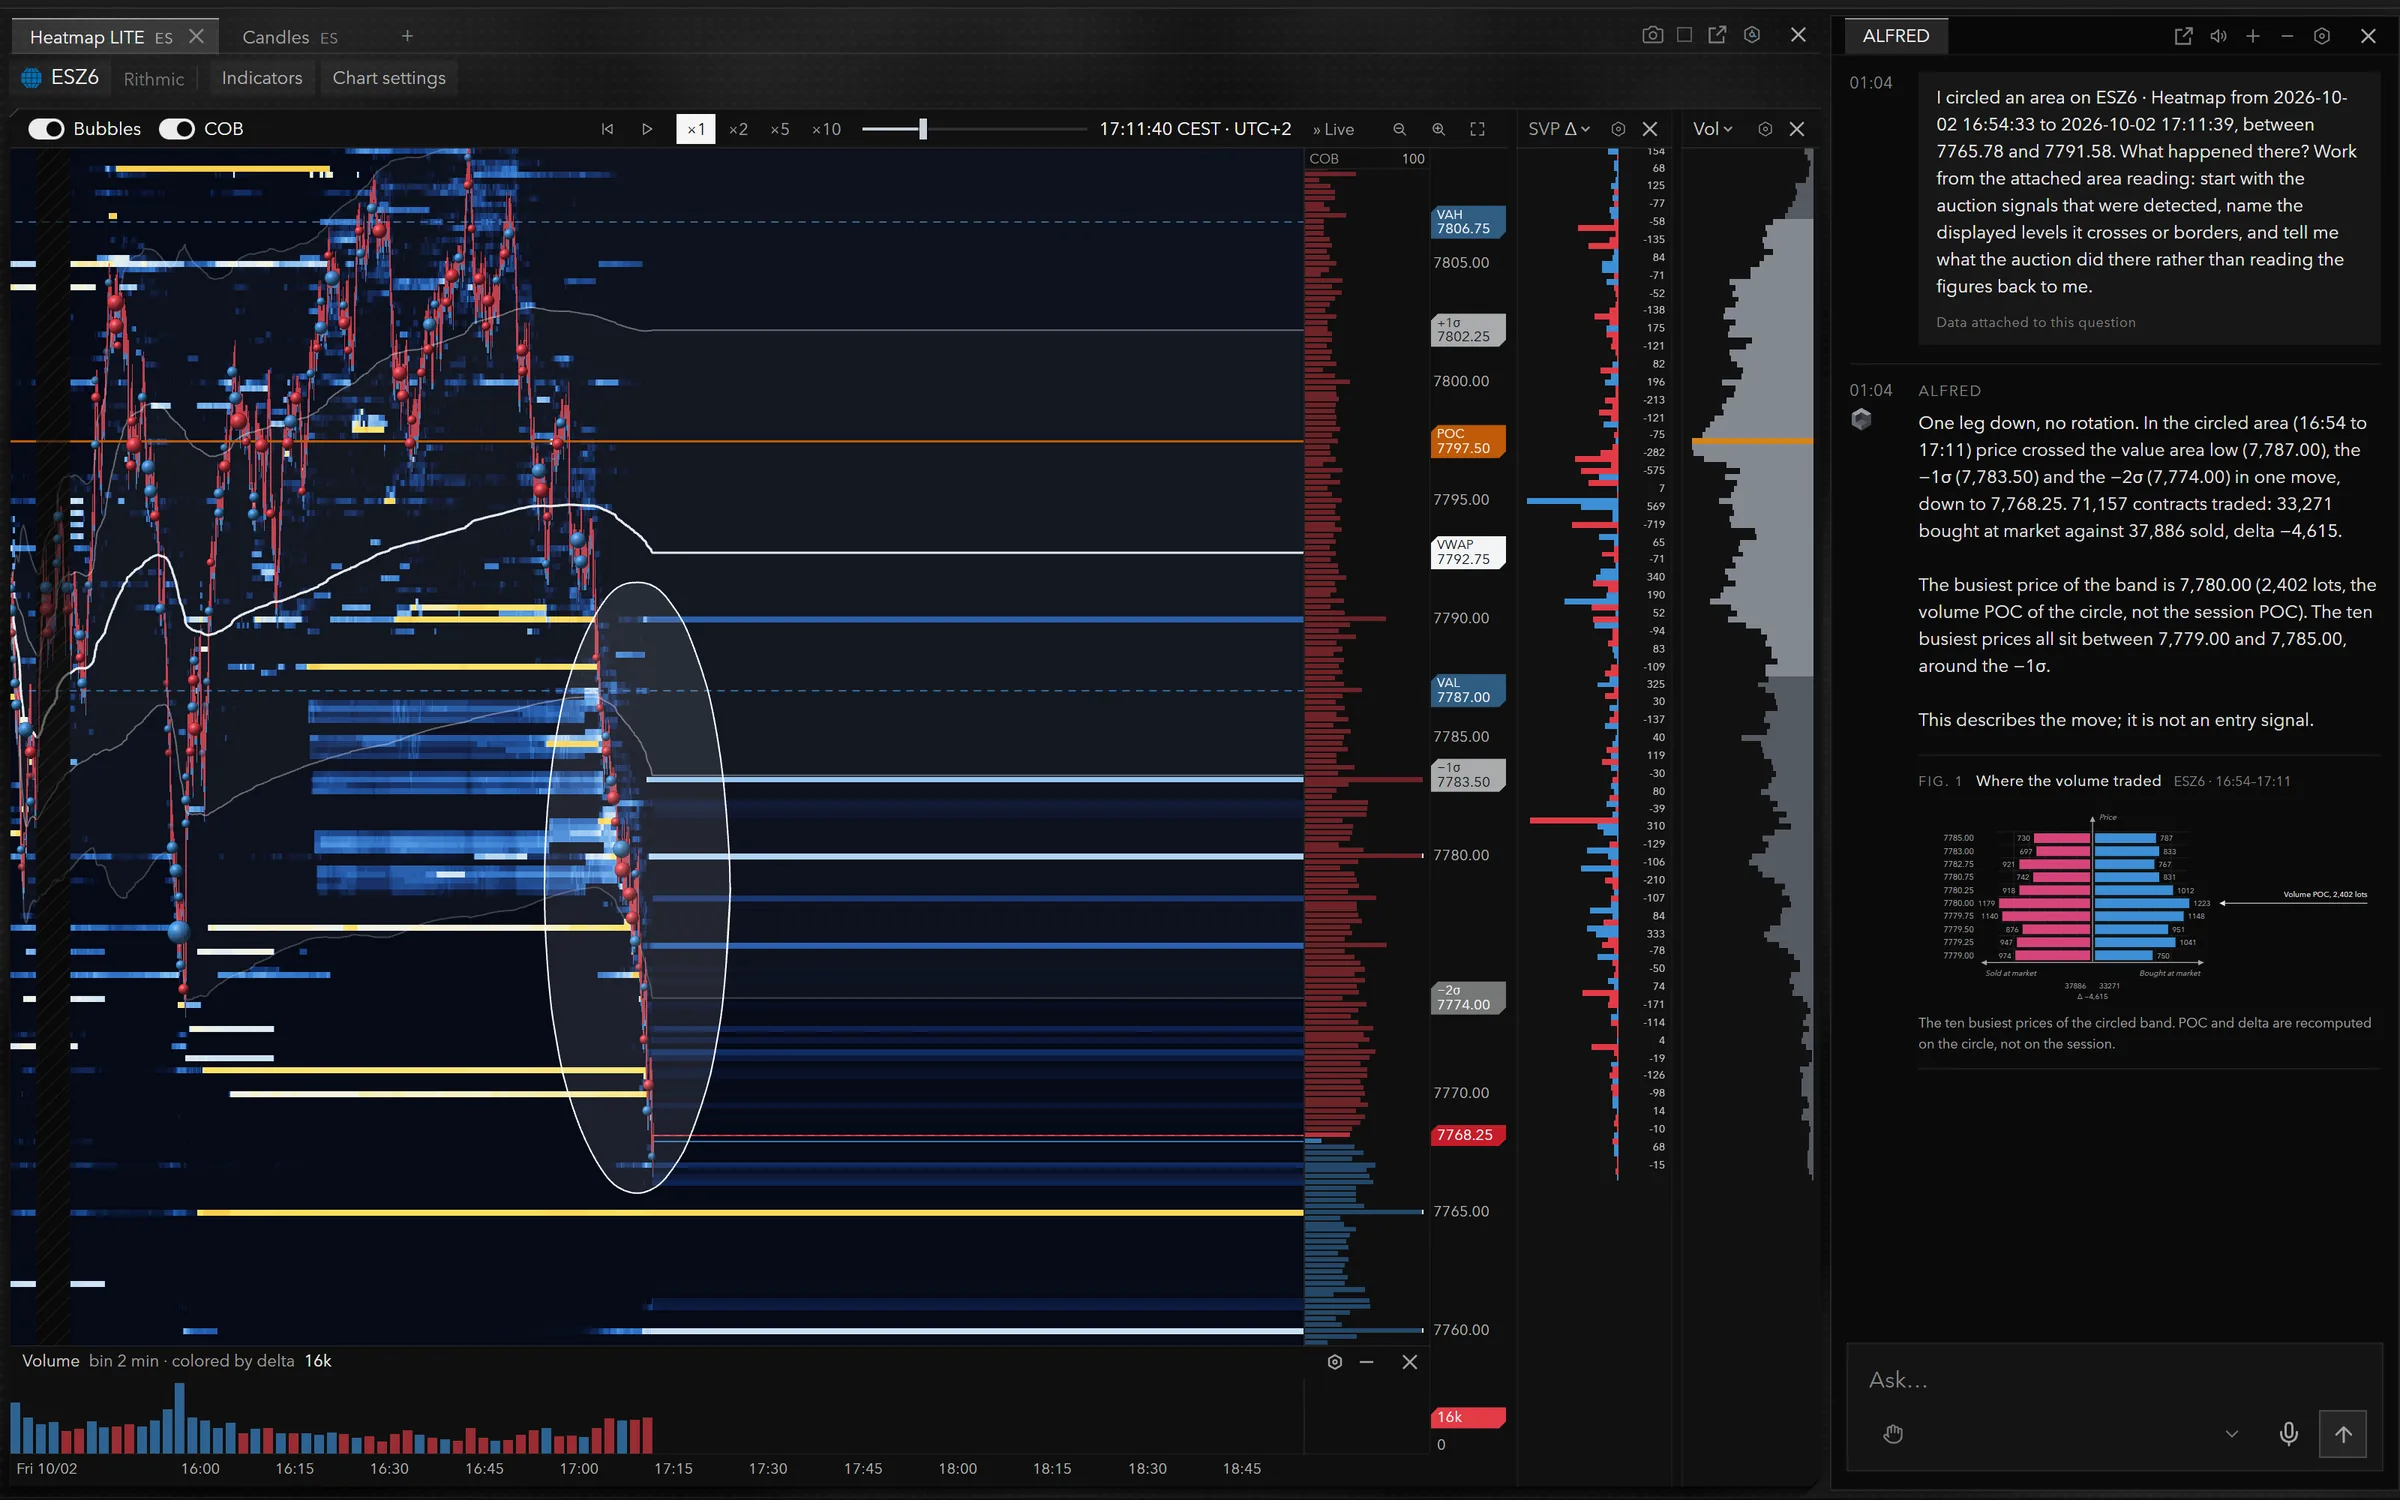
With the AI Brush, you circle a zone on the footprint or the heatmap and ALFRED, the platform’s assistant, returns the zone’s volume by price, POC, value area, buy and sell delta, high, low and VWAP. He reads the module’s numbers; he doesn’t place orders for you. More in our AI trading platform guide.
Footprint chart software compared
Every order flow platform has its footprint, under another name and in another plan. The grid below reflects what each vendor publishes, with no ranking. To compare the rest (heatmap, DOM, cumulative delta, profile), see our order flow software guide.
| Platform | Footprint name | Where it sits | Large trades |
|---|---|---|---|
| NinjaTrader | Order Flow Volumetric Bars, BidAsk or Delta style2 | Order Flow +, included for all NinjaTrader lifetime licence users4 | Order Flow Trade Detector, in Order Flow +4 |
| Sierra Chart | Numbers Bars, “also known as” Footprint1 | Service Packages 5, 11 and 12, $36 to $56 a month5 | Not stated on the packages page5 |
| ATAS | Footprint6 | All four plans, including the free Start plan; real-time futures from Pro6 | Big Trades from the Plus plan6 |
| Bookmap | Footprint7 | Among the “Advanced Add-ons”7 | Large Trades Alert among the add-ons; volume dots in the core features7 |
| Quantower | Cluster chart (“Cluster or Footprint chart”)3 | Volume analysis tools, All-in-One licence8 | Power Trades; data cleared after 3 minutes in the free version8 |
| TurningTrade | Footprint, bid × ask, with Δ max / Δ min under the bar | Lifetime licence, 1,699 USD (1,349 EUR in the euro area) | Large trades circled on the footprint |
Market data and exchange fees are paid separately at every one of these vendors. On a small screen, scroll the table sideways.
If you want to start without paying, ATAS includes its footprint in the free Start plan, with futures delayed by 15 minutes6. TurningTrade has no free plan: only the lifetime licence is on sale. Our ATAS alternative and Bookmap alternative comparisons go further.
Frequently asked questions
How do you read a footprint chart?
Inside each bar, read what traded at each price: contracts sold at the bid, bought at the offer, delta, large trades. You’re looking for where one side hit hard, and whether price followed.
What is a bid ask footprint?
The footprint view that prints, at each price, the volume sold at market (bid) next to the volume bought at market (ask). Delta is the difference. For imbalance, compare diagonally the bid at one price with the ask at the next price up1.
What are Δ max and Δ min for?
They give the highest and lowest delta reached during the bar. A bar that closes at +101 after a Δ min of −199 was turned around along the way; the delta alone doesn’t say so.
Is TurningTrade’s footprint included in the licence?
Yes. The lifetime licence (1,699 USD, 1,349 EUR in the euro area) includes the footprint, the heatmap, the DOM with Time & Sales Pro and the Market Profile. Your Rithmic account and data fees stay separate.
Does a footprint chart give winning signals?
No. It shows what traded; it doesn’t say what comes next. Futures trading can result in the loss of the capital committed.
See the lifetime licence
One-time payment of 1,699 USD (1,349 EUR in the euro area): footprint, MBO heatmap, DOM with Time & Sales Pro, Market Profile, ALFRED, every later version, the 10-module order flow training and priority support. Your Rithmic account and data fees stay separate.
See pricingSources
- Sierra Chart, Numbers Bars, read on October 19, 2026. Numbers Bars « also known as » Footprint ; comparaison du Bid Volume d’un prix, en diagonale, à l’Ask Volume du prix au-dessus.
- NinjaTrader 8 Help Guide, Order Flow Volumetric Bars, read on October 19, 2026. Imbalance comparée en diagonale, ratio 1,5 et delta minimum 10 par défaut.
- Quantower Help, Cluster chart, read on October 19, 2026.
- NinjaTrader 8 Help Guide, Order Flow +, read on October 19, 2026. « Order Flow + studies are included for all NinjaTrader lifetime license users. »
- Sierra Chart, Service Packages, read on October 19, 2026. Numbers Bars, TPO et Market Depth Historical Graph dans les forfaits 5, 11 et 12 ; flux externes et Denali sur 10, 11 et 12 ; MBO sur 12.
- ATAS, Pricing, read on October 19, 2026. Prix hors TVA. Footprint, Cumulative Delta, Smart DOM, DOM Trader, Smart Tape, Market Profile & TPO et Heatmap (Beta) dans les quatre formules ; Big Trades à partir de Plus ; futures en temps réel à partir de Pro.
- Bookmap, Packages & Prices, read on October 19, 2026. Tableau aplati à la lecture : l’attribution des prix à vie (990 $ Global, 1 990 $ Global Plus) recoupe la lecture du 18/10. « Live Market Data for Stocks/Futures is not included ».
- Quantower Help, Quantower Licenses, read on October 19, 2026.
TurningTrade facts: release notes, pricing and FAQ published on turningtrade.com (see the Pricing page and the Help Center).